Actualités
Sommaire
50 résultats
-
Ils mouillent le maillot
Sport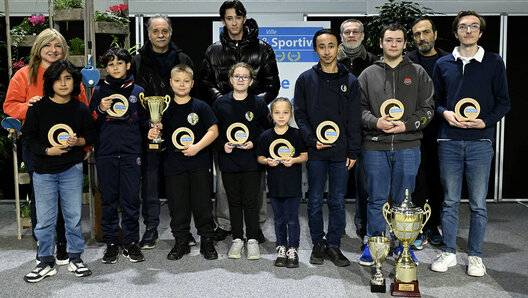
-
À quoi rêvent les eaux dormantes ?
Médiathèque Boris-Vian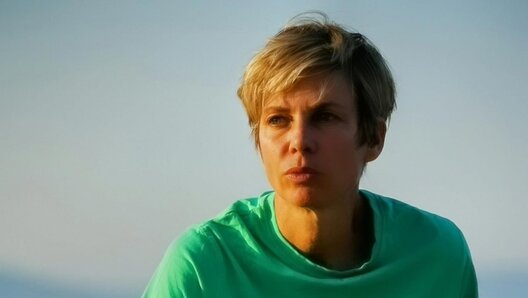
-
Une courtière à votre service
Commerce
-
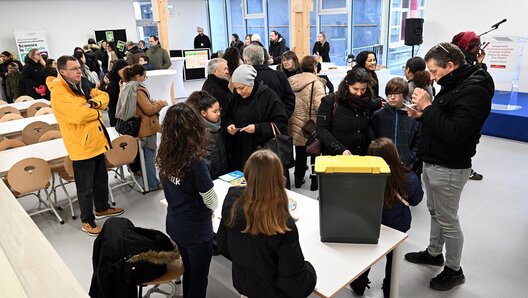
Des Tremblaysiens au cœur du défi « Familles zéro déchet »
Développement durable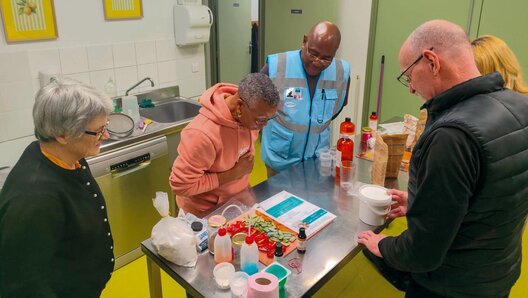
-
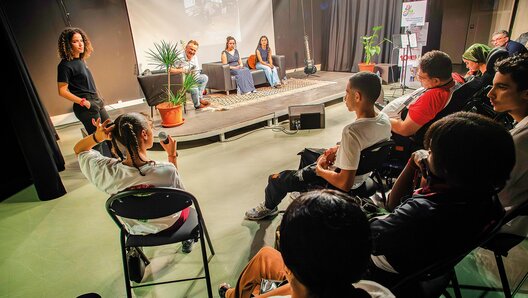
Les droits des femmes, un combat intergénérationnel
Droits des femmes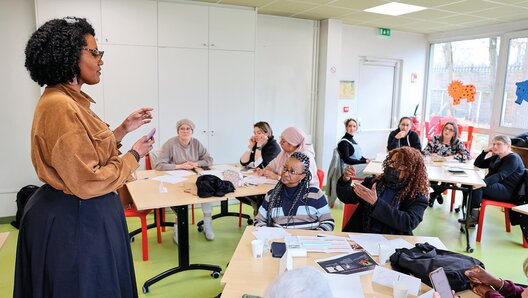
-
Le pari jeunes du Tomcat's
Baseball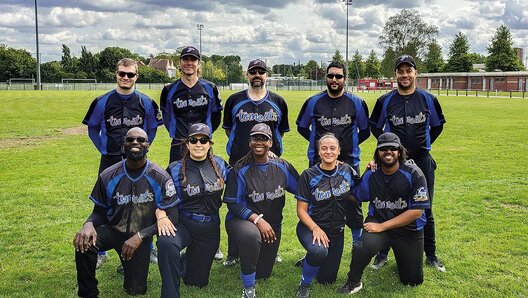
-
Magique comme Mattéo
Handball